The Tocalino Index as a Reference to US Stocks
Can The Tocalino Index Tell Us Anything About US Stocks And Countercyclical Policies?
Sebastiao Buck Tocalino, May 13, 2020
-
Central bank efforts are more desperate than ever to fight the deflation of financial markets;
-
Countercyclical policies may put out the fire in the woods, but they will set forests aflame just ahead;
-
Can the Tocalino Index say anything about the bouts of exuberance in U.S. stock exchanges?
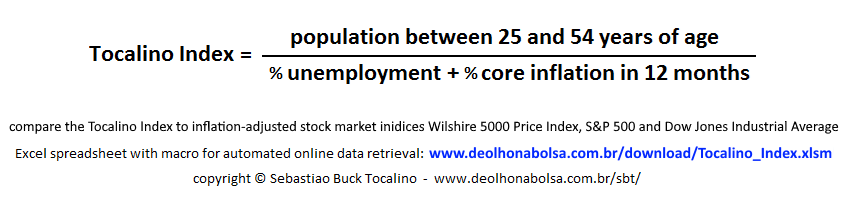
Years ago, while exploring and associating some economic data in a spreadsheet, I developed a curious indicator. At the time, I wrote a brief presentation of the Tocalino Index. Based on statistical records, I take the most promising population group for aggregate consumption and divide it by the sum of the rates of unemployment and core inflation in the U.S.
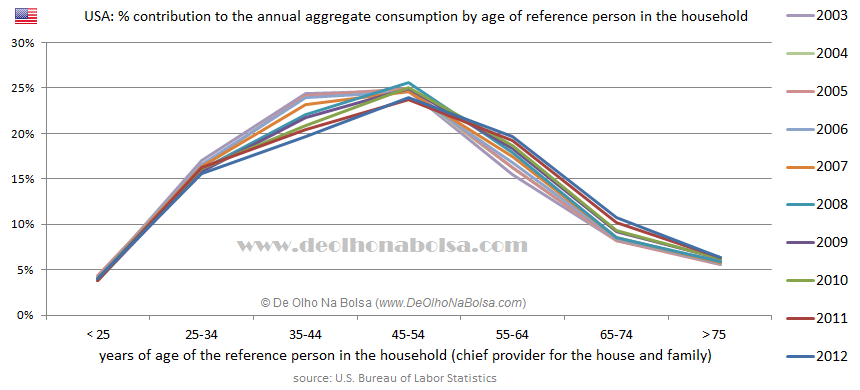
The chart below shows American households by the age group of their main provider. Ten years of research show their average annual share of national aggregate consumption.
Emancipated young people, from age 25 onwards, have an increasing contribution to consumer demand. While those groups above 55 years of age show a drop in their participation. Therefore, the consumer market should gain momentum when the 25 to 54-year-old cohort increases, and decelerate when the size of this population decreases. Inflation, by increasing the cost of goods and services, makes consumption less affordable. Worse yet, unemployment is a factor that dramatically inhibits the expenditures of the individual or his/her entire family.
By expressing this basic concept with a very simple formula, the Tocalino Index by itself deserves greater attention in any free-market capitalist economy. But the result is truly remarkable when we compare it to the behavior of the stock market in the U.S.
In August 2014, the index appeared on different websites and caught the attention of some reputable professionals. Among them were the people responsible for Peak Prosperity's Daily Digest (by Chris Martenson) and the savvy investment strategist and analyst Lance Roberts. I also received an email from the former Chairman of the Department of Economics at the University of Chicago, Harald Uhlig, who is now a consultant for the Federal Reserve Bank of Chicago and the European Central Bank. In 1990, his Ph.D. thesis addressed "Costly Information Acquisition, Stock Prices and Neoclassical Growth." Uhlig suggested the use of GDP in my formula. The suggestion was logical and welcome. But in trying to do so, in different ways, it only diminished the correlation between the index and the stock market.
Although the indicator is not equally relevant when adapted to Brazil (probably due to the low purchasing power of the population), I follow it carefully. After all, the American stock market has its influence on all others around the globe.
However, in that first presentation, I drew two independent graphs, each on its own vertical scale. One scale to the right, for the inflation-adjusted Dow Jones Industrial Average, and a different scale to the left for the Tocalino Index. In other words, I just adapted one graph over the other, without respect for their proportions. On top of that, I did something very foolish: I used the peaks of 2000 and 2007 as references for the overlap. In other words, I was looking for correspondence precisely in the most speculative and inadequate phases of the financial market. By doing it, I distorted the relationship between the lines and overshadowed the main message of the chart.
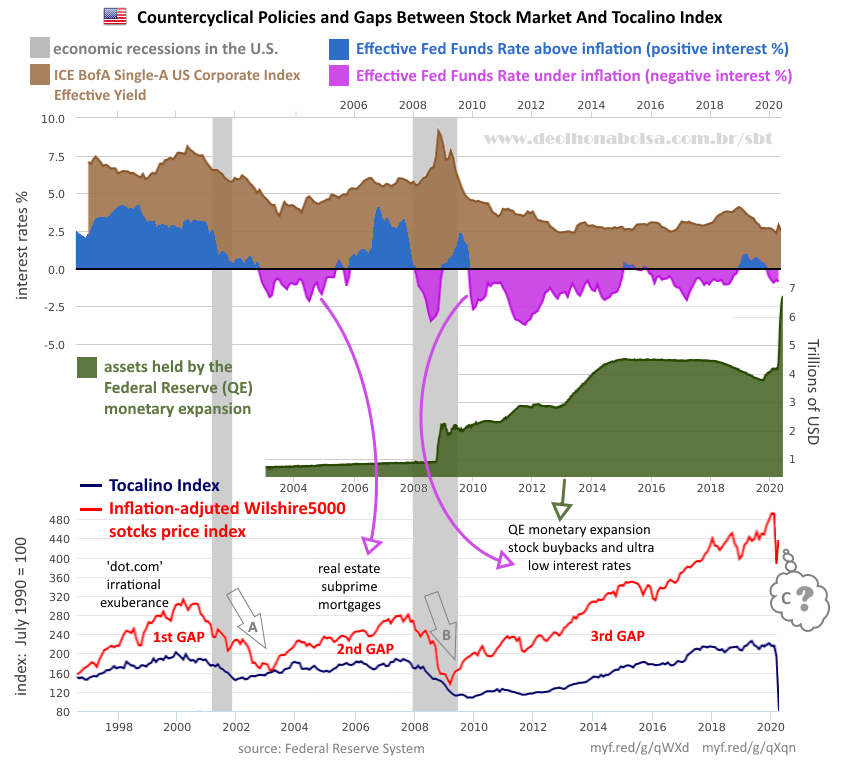
The best match would be exactly in the major part of their trajectories: the entire period before September 1996. Since then, we had a sequence of three huge discrepancies, or gaps, interspersed by two major corrections:
1) The first was a speculative wave that Alan Greenspan, then Chair of the Federal Reserve, referred to as an "
irrational exuberance". It arose out of enthusiasm with the World Wide Web and the anticipated potential for technology companies.
2) The second was the outcome of a
real estate fever, financed with artificially low real interest rates and some very
irresponsible mortgages and credit behavior.
3) The third started with
monetary expansion (QE), which indirectly financed
stock buybacks and increased corporate debt, with
unreal real interest rates (again).
In my initial presentation of the indices, overlaid on different scales, I should never have used as reference any of those moments when the market moved furthest away from the demographic and economic fundamentals.
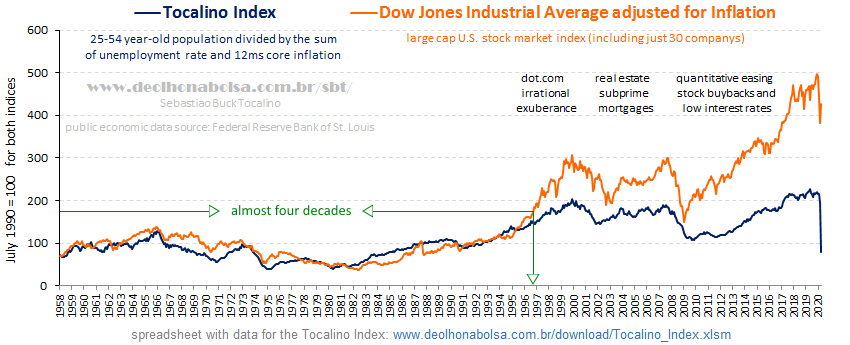
Below is the correct association between the Tocalino Index and the inflation-adjusted Dow Jones Industrial Average. Instead of overlapping, now they are on the same vertical scale. In July 1990, both leveled at 100 on the Y-axis of the chart. The comparison becomes much more coherent and informative.
Since I could only get data on core inflation as far back as January 1958, that marks the starting point of the Tocalino Index. Its trajectory closely resembles the path of the Dow Jones, from January 1958 to August 1996. That is almost four decades. Even later, as the stock market moved with greater thrusts of self-reliance, distancing from my indicator, the similarity in their underlying patterns remained quite noticeable.
The Dow Jones Industrial Average tracks only 30 major American companies. With plenty more stocks, the S&P 500 yields a similar comparison against the Tocalino Index.
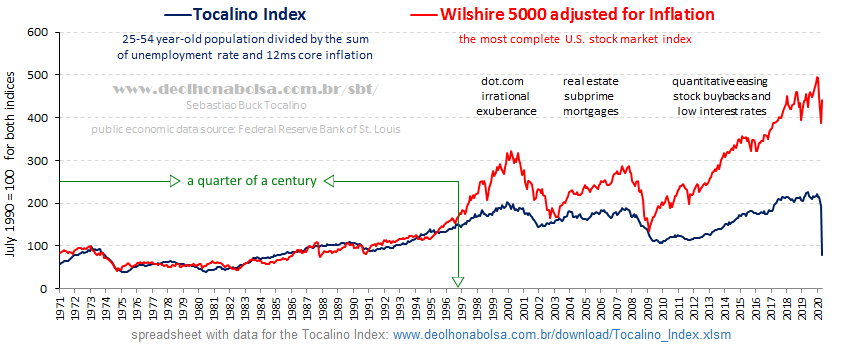
But the best correlation occurs when I use the most comprehensive of all stock indices: the Wilshire 5000 Price Index (WILL5000PR). Unfortunately, the collected data for this one starts in January 1971, thirteen years shorter than the range of the Tocalino Index.
Due to its best correlation and the convenience of access from the St. Louis Federal Reserve's economic data repository, I adopted the inflation-adjusted Wilshire 5000 for my routine charts. Especially after this repository limited the disclosure of the Dow Jones and S&P 500 data to only ten years of history.
The proximity between those lines, in the first part of the graph, is remarkable. As for the following period, their rapprochement took place in two corrective movements of the American stock exchanges:
A) the bursting of the "dot.com" technology bubble;
B) the collapse of the subprime mortgage bubble.
These major corrections were not limited to American markets. They were bear markets that traveled the world!
During most of the 20
th century, the proximity between the indexes suggests a more efficient and democratic market back then. Until August 1996, the stock exchange seemed more anchored to the demographic and economic context of the nation.
So far, rather than threading the guidelines of the real economy, stock exchanges are chasing a frenzy of financial engineering and experimental policies in the 21
st century. And this modern unorthodox behavior troubles me deeply! Maybe you will call me old-fashioned.
Undoubtedly, the past 24 years have shown successive exaggerations. The period involved speculation far above normal (1
st major gap between the lines), followed by deliberately low interest rates (2
nd and 3
rd gaps), absurd monetary expansion (3
rd gap), and shameful stock buybacks (3
rd gap).
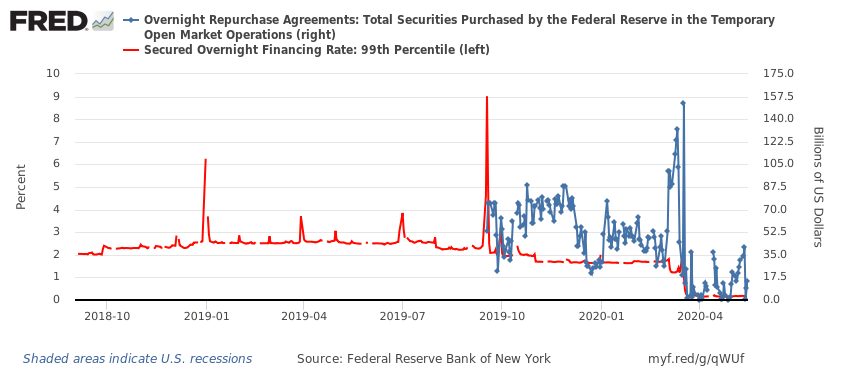
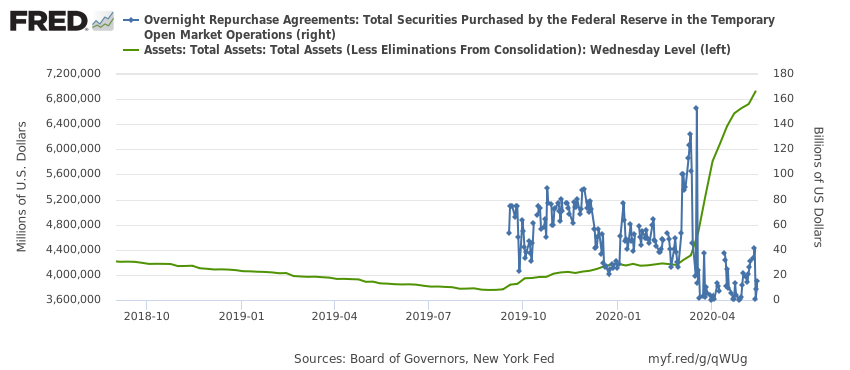
Even before COVID-19, the Federal Reserve System was fighting confidence bleeding in this heretical financial economy. In September 2019, overnight interest rates suddenly spiked to 9% a.a. It was the voice of discomfort and reluctance screaming in the overnight funding of institutions. To calm down interest rates, the Federal Reserve had to bail out the Repo Market.
With the current pandemic, Fed interventions in the Repo Market intensified further in March, until the central bank went ballistic and began to rapidly expand its balance sheet with asset purchases.
It is important to remember the change in American financial legislation that took place at the end of the 20
th century. Alan Greenspan had already pointed out an "irrational exuberance" in the stock market. Despite that, the U.S. modified the law that regulated the financial sector. The country gave up the regulation that had been efficient for 66 years!
Since 1933, the former Glass-Steagall Act had defined the separation between investment banks and commercial banks. Commercial banks, keeping savings and checking accounts of the population and so many small and medium-sized enterprises, should be more prudent and conservative. The legislation protected customers and institutions and prevented systemic risks to the economy.
Investment banks served bolder clients more prone to speculations and, theoretically, more resilient to possible setbacks. The separation in these types of banking activities reduced the risk of contagion from financial speculation to most of the economy.
American demographics in the 1990s favored the economy. With budget surplus, U.S. public debt was decreasing. In times of plenty, it is not uncommon to dismiss prudence as unnecessary pessimism. Thus, the financial industry managed to get a change in legislation from Congress. Greenspan and Larry Summers, then-Secretary of the Treasury, advised President Clinton to enact the 1999 Gramm-Leach-Bliley Act (GLBA). They were removing restrictions on affiliations between commercial banks and investment banks or other agencies with speculative activities.
The euphoria with internet technology piqued banks' interest in more daring opportunities. Fortunately, the bubble burst shortly after that, in the year 2000. But the seed of systemic risk was already planted.
The busted technology bubble and the '9/11' attack on the Twin Towers prompted the Federal Open Market Committee to lower interest rates. The intention was to accelerate economic recovery. But artificially-low interest rates increased irresponsible behavior in granting mortgages and refinancing real estate. The new banking legislation was showing its flaws. Banks were highly leveraged and engaged in very risky businesses. The systemic risk of an international collapse became very real.
As expected, in the heat of the subprime crisis, the Federal Reserve came to the rescue once more, creating massive amounts of money. The generous aid was much more directed towards the financial sector than American society. With such impressive monetary expansion and very low interest rates, banks financed many companies in the buybacks of their stocks. Besides creating demand and price for their equities, the reacquired shares were then eliminated from existence, allowing profits and dividends to be split among a smaller number of remaining shares. Even if companies did not grow their operating profits, they increased earnings per share.
While financial engineering took the stage, economic activity sulked behind the scenes. It seems to be the curse of this century! Once these countercyclical policies start to spiral out of central banks, it is difficult to escape the whirlpool and side effects.
Despite this year's abrupt bear market, we are still in a bubble. Full of distortions, this third bubble is bigger and more troubling than the previous two.
Unemployment surged and pushed the Tocalino Index violently downwards. But stocks remain oblivious and aloof. A significant rise of the Tocalino index seems unlikely to me. It makes more sense to imagine a farther drop in stock prices. Instead, I hear a lot of talk about a V-shaped recovery.
Central bank policies are more desperate than ever to fight the deflation of this third bubble. They will try to stretch it beyond imagination. Buying equity ETFs and corporate debt shows that quantitative easing is here to stay! Countercyclical policies may put out the fire in the woods, but they will set forests aflame just ahead. The Federal Reserve is both: fireman and arsonist. A very serious paradox!
Stay tuned to the
Tocalino Index and don't miss the next thrills of this intriguing series.
(I must thank Harry S. Dent Jr., whose books brought to my attention the importance of demographics many years ago)
*Tocalino Index is updated once a month, with the releases of the unemployment rate and the consumer price index. Usually between the 10
th and the 14
th day of the month. Tocalino Index spreadsheet (with macros) is available at:
First presentation of the Tocalino Index in 2014:
Third party references to the Tocalino Index:
By Sebastiao Buck Tocalino
Original article
here.
More articles and commentaries by S.B.Tocalino in
Advisor Perspectives.
"inclination (...) cannot alter the state of facts and evidence"
(John Adams)

.jpg)
 more reading material
 confira outros textos